Screwing Around With SDR
A few weeks ago, I pointed a camera at the East River to take pictures of the ships as they pass by. I wanted to know more. Every sufficiently large ship is constantly broadcasting information about itself via the Automatic Information System (AIS). It is, roughly speaking, a digital signal broadcast on the ship’s short range VHF radio. Anyone can receive it. So, I decided I wanted to learn all about AIS and read the signals for myself.
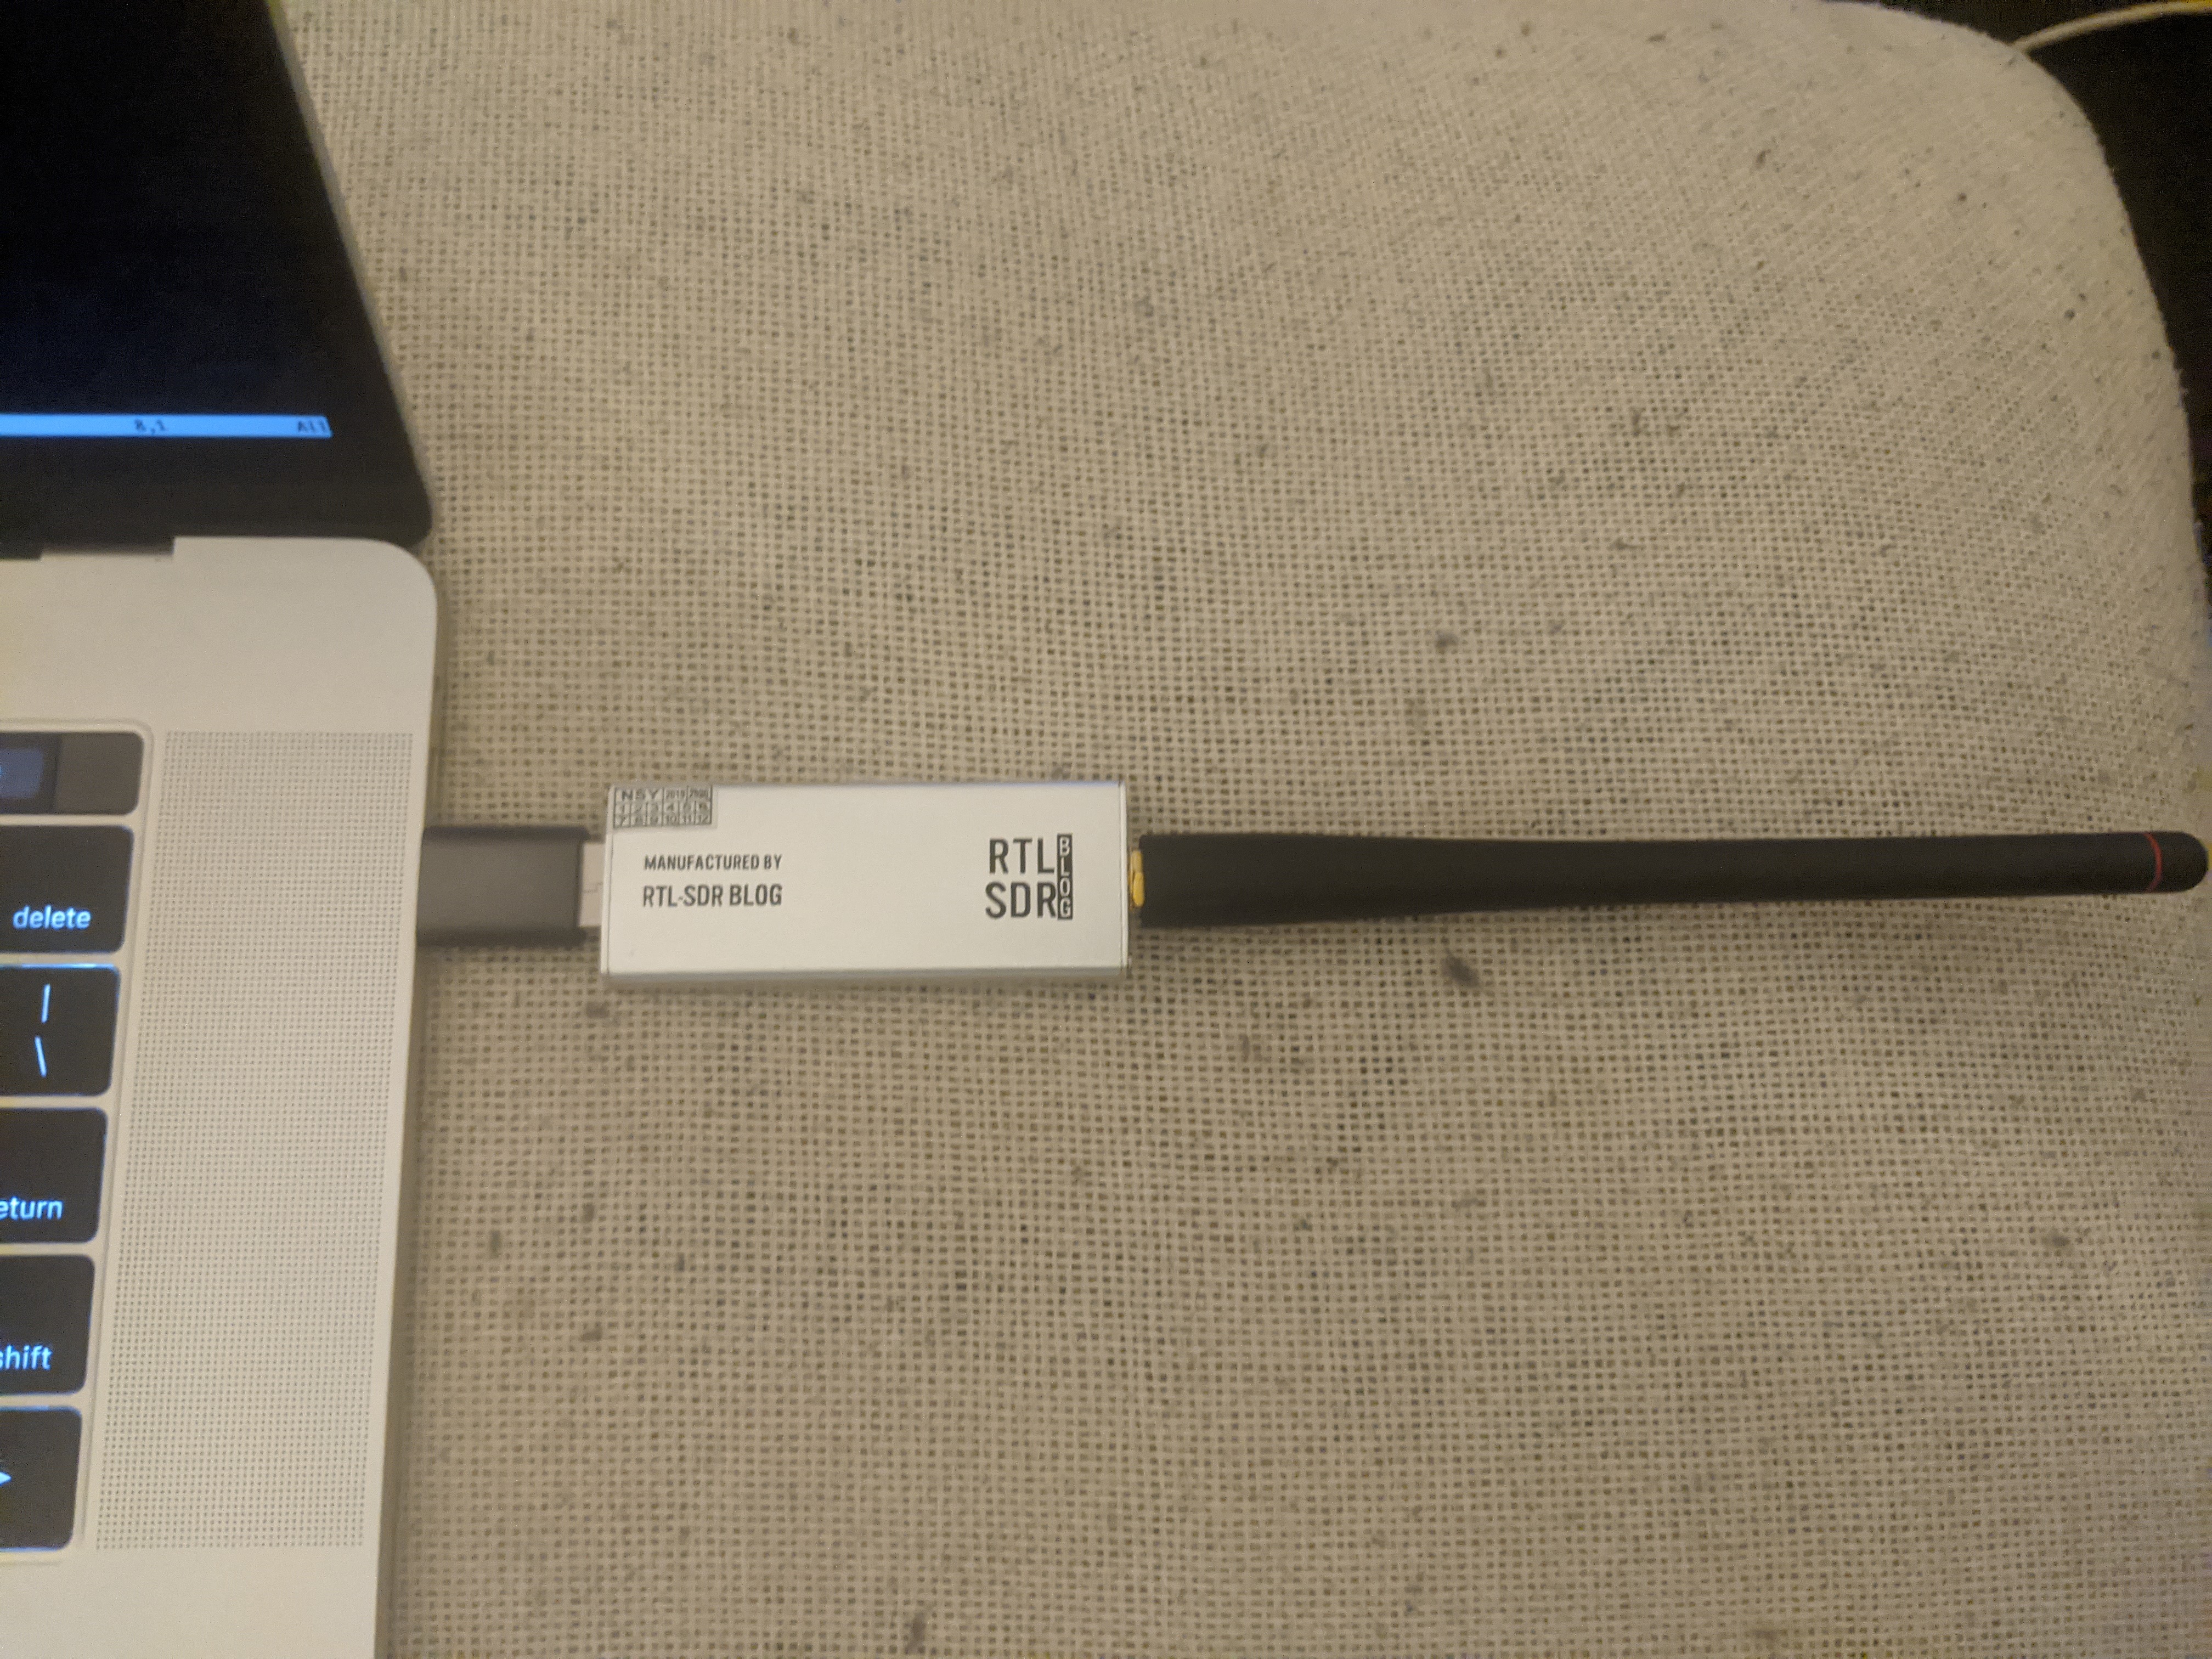
I started researching SDR kits, and at first everything I found was super expensive. My friend Mason explained to me that receiving is cheap, and transmitting is where the real cost is. I took his advice and bought the RTLSDR receiver you see breaking the USB-C port on my Macbook below.
Proof of Concept⌗
First I had to check and see if it works. I downloaded a piece of software called SDRGlut and fired it up. AIS is broadcast on VHF channels 87B and 88B - 161.975 MHz and 162.025 MHz. Let’s see if I see anything.
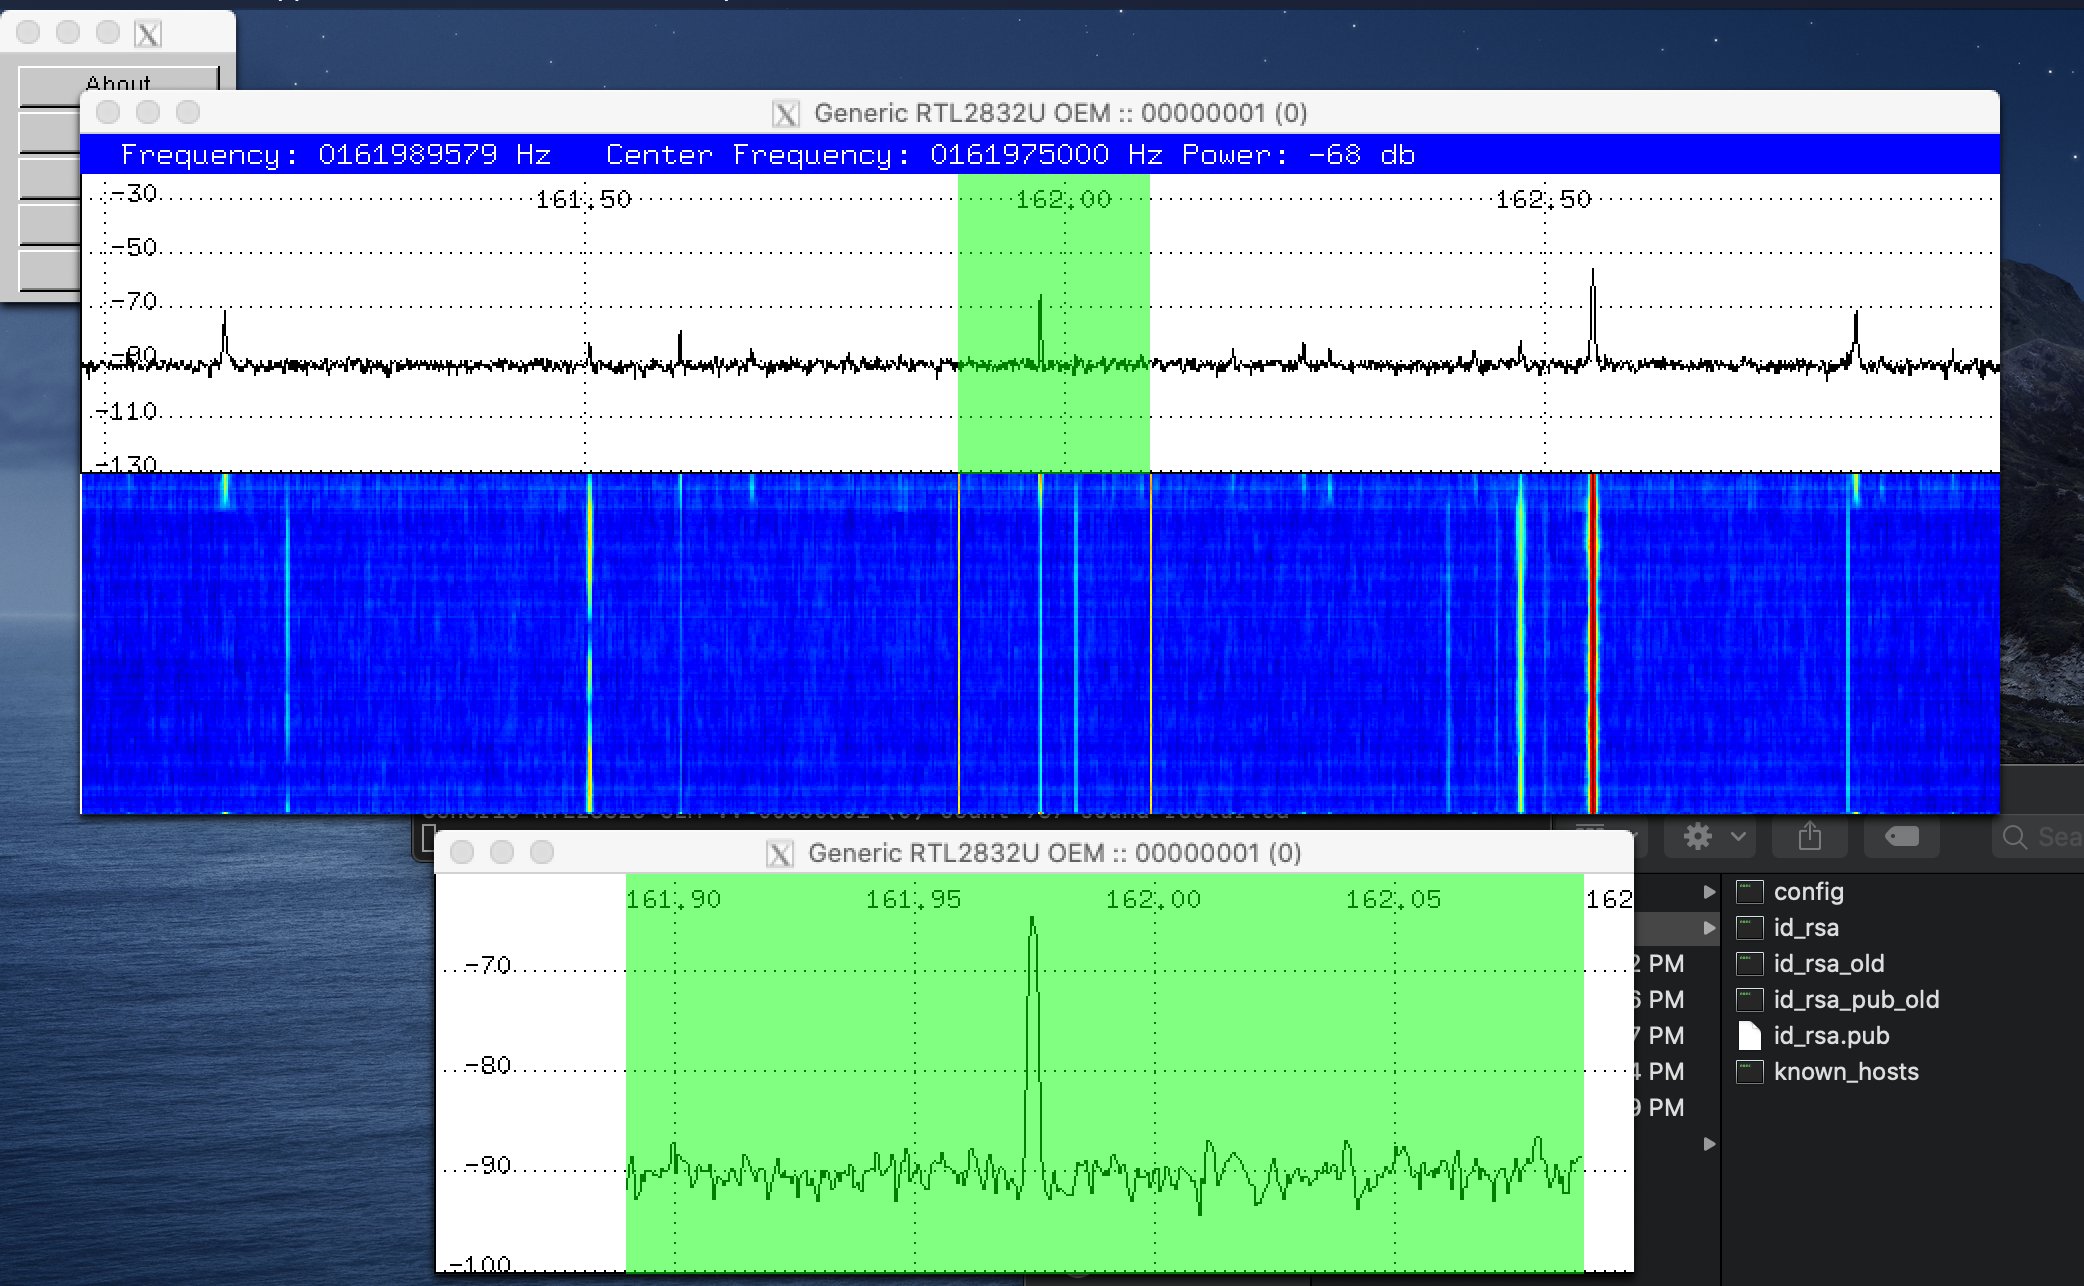
On the top display, you see a waterfall graph. Signal strength is represented by color, and time goes down. There are two distinct lines at 161.975 MHz and 162.025 MHz, right where we’d expect them to be.
(The really bright line at 162.550 is the NOAA WX1 weather broadcast.)
Messing with Python⌗
Like a Real Software Engineer, I copied and pasted some code into a Jupyter notebook.
from rtlsdr import RtlSdr
import numpy as np
import pandas as pd

sdr = RtlSdr()

# configure device
sdr.sample_rate = 9600 * 128 # Hz 128 samples per bit
sdr.center_freq = 161.975e6     # Hz -- 161.975 MHz, AIS channel A, VHF 87B
sdr.freq_correction = 60   # PPM -- don't know what this does
sdr.gain = 'auto' # probably fine?

signal = sdr.read_samples(16*128)

# [(0.0117647058823529-0.19215686274509802j),
# (-0.0117647058823529+0.1843137254901961j),
# (-0.050980392156862786-0.17647058823529416j),
# (0.07450980392156858+0.13725490196078427j),
# (-0.11372549019607847-0.16862745098039222j),
# (0.0980392156862746+0.13725490196078427j),
# (-0.13725490196078427-0.13725490196078427j),
# (0.15294117647058814+0.0980392156862746j),
# (-0.17647058823529416-0.10588235294117654j),...]
So, first, I was excited it worked. Second, however, I was confused. Why am I getting complex numbers? I asked the Internet, and Mason explained:
it uses something called quadrature sampling, meaning instead of your normal mental model of sampling where every sample is equidistant, it samples two samples close to each other at what would be a phase angle of 90 degrees if viewed as complex, and ignores two after that
this divides the signal into two phased components, one in-phase and one out-of-phase, from which we can recover a close approximation of what it was
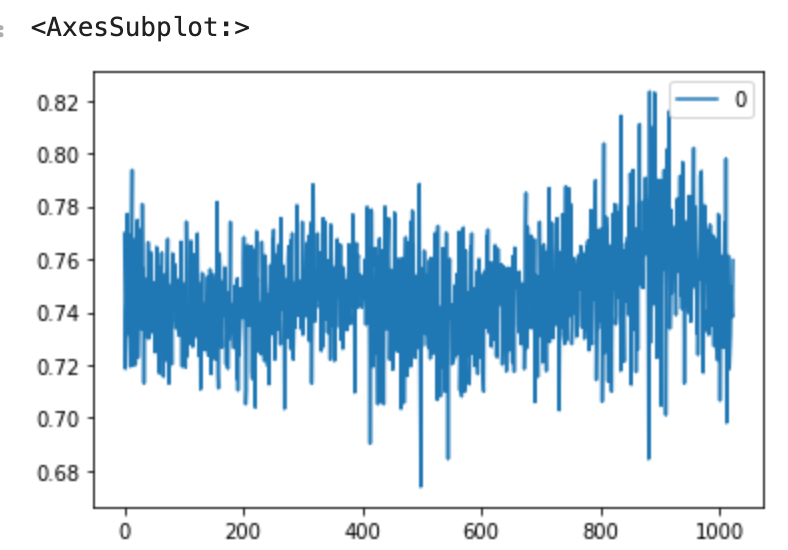
Still doesn’t make a ton of sense to me, but I can roll with it. I tried taking the magnitude of the complex samples and graphing that over time. Looks like something, but still not clear what.
More messing around⌗
I recorded 30 seconds of data (a 90MB csv file, by the way) to mess with offline
rather than leaving a heavy radio hanging off my laptop. Then, because pyrtlsdr
suggested it, I created a power spectral density plot.
pyplot.psd(signal, NFFT=8192, Fs=sdr.sample_rate/1e6, Fc=sdr.center_freq/1e6)
pyplot.xlabel('Frequency (MHz)')
pyplot.ylabel('Relative power (dB)')
pyplot.xlim(162.025,162.050) # zoomed really close in on 162.025 MHz - 162.050 MHz

pyplot.show()
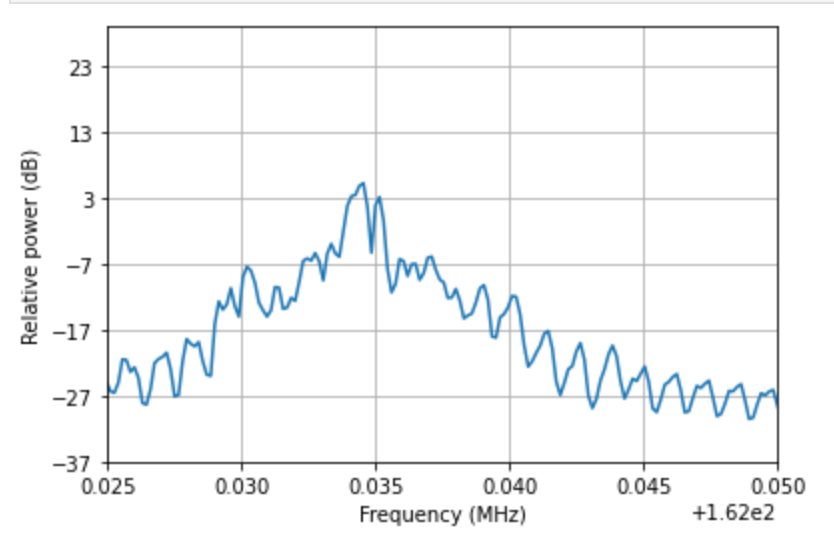
I screwed around with this a little bit to make the line “look good”, whatever that means. Interesting finding is that the peak of the signal is right around 162.035 MHz. I expected it would be right on 162.025 but I guess not. It makes sense that the VHF 88B channel would be from 162.025 to 162.050, so the peak would be right near the middle of that.
Next steps⌗
I need to read up on Minimum-Shift Keying so I can figure out how to differentiate between a zero and a one. I’m sampling at about 128 samples per bit. I think I should be able to take about 64 samples, run an FFT on that and find the local frequency with the most power in the VHF channel. My hypothesis is I should be able to tell the difference between a zero and a one like that.
Hopefully, more to come.